Positron is a new IDE by the creators of RStudio that’s built on VSCode’s open source core, but layered with extra bells and whistles for R (and Python, if that’s your thing). And those bells and whistles’ music is particularly well tuned for R developers working with compiled code, which was always a rather rough experience in RStudio. As someone who basically uses R as a nice LISP-y scripting language to orchestrate calling low-level compiled code from other languages, this is a very welcome addition to the R ecosystem for the following reasons:
A Decoupled R Session
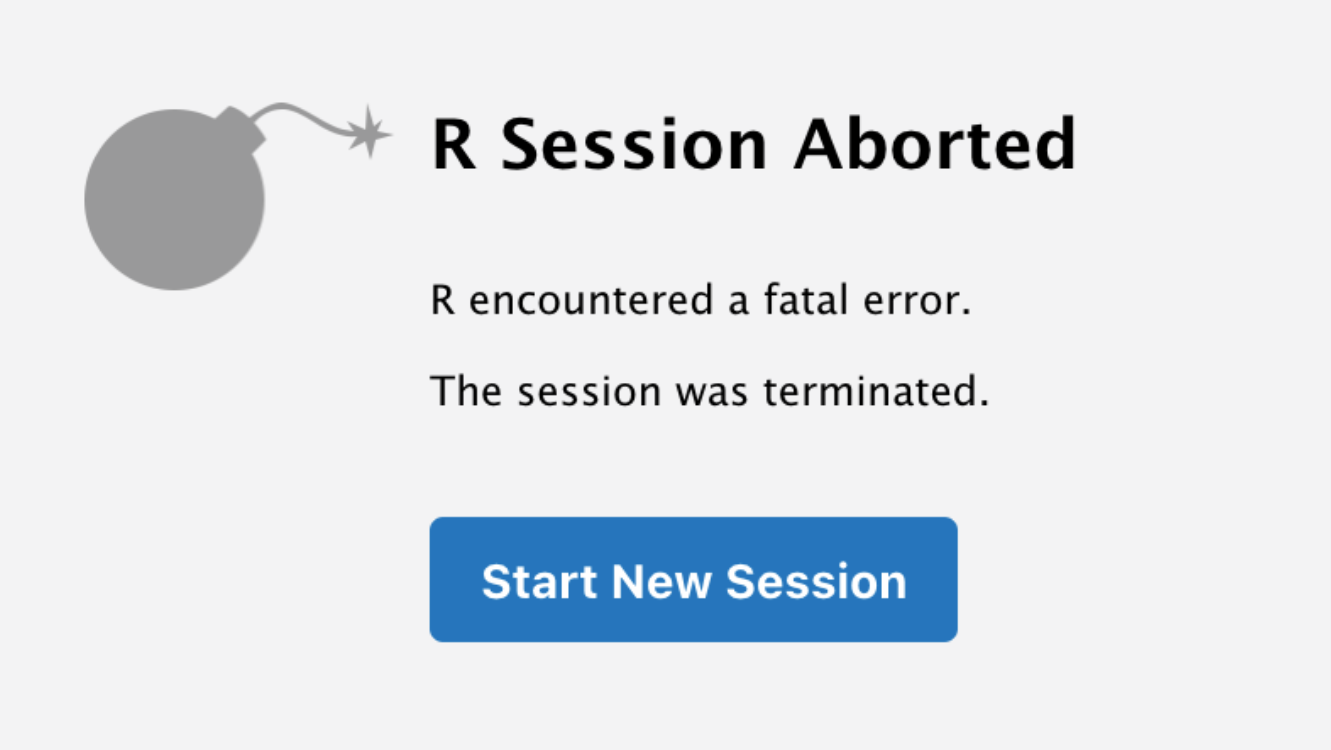
This was one of Positron’s standout features when it was unveiled at Posit::conf(2024): the R session is no longer tightly bound to the IDE. This means that when R crashes due to an out-of-bounds memory access or something similar, the entire IDE doesn’t go up in flames—just the R session. A much nicer developer experience, particularly if you like to play fast and loose with pointers.
Figure 1: Goodbye, old friend.
VSCode extension: clangd
VSCode has great extensions for C++ code that make development much, much easier. For example, the extension clangd analyzes your C++ code and provides real-time feedback, without having to compile your code. You can use it to catch errors, perform code refactoring, and even check the size of structs (including automatically inserted padding!). Need to fit a struct into a cache line? clangd can help you know exactly how your data is laid out in memory. You just need to install the extension and generate a compilation database using pkgload:::use_compilation_db() to get started.
Figure 2: Inspecting the contents and padding of a struct.
Interactive Debugging with CodeLLDB
The other killer feature is being able to use CodeLLDB: an extension that allows you to debug C++ code and set breakpoints and inspect objects interactively. You could technically do this with R manually before by attaching lldb to an R session launched from the command line, but inspecting complex class structures and setting breakpoints using the command line is much harder than doing so in the GUI.
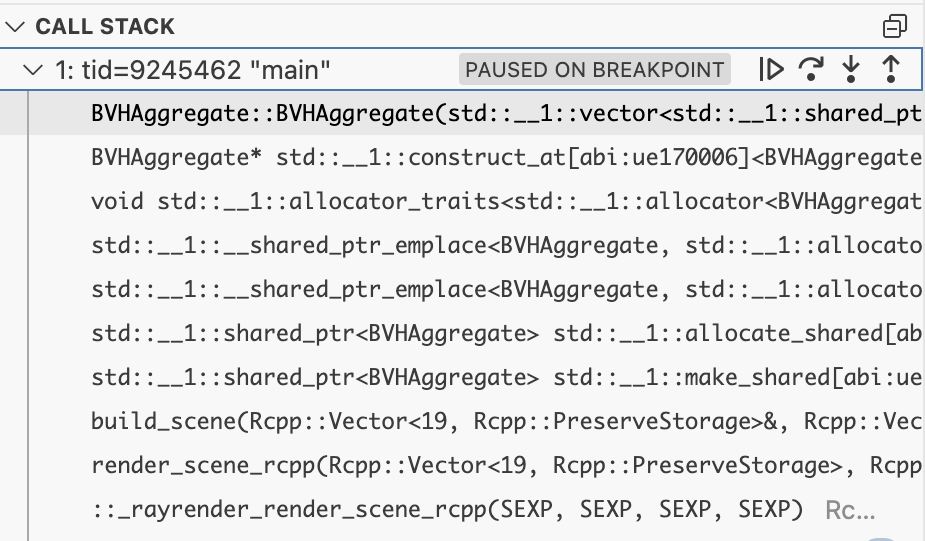
What’s really cool is the ability to see the full call stack, and interactively jump around and inspect the current state of the program at any point. I’m sure there was a way to do that manually in the command line with lldb, but there’s no way I was going to internalize the full API of lldb to do something that a couple extra breakpoints (or print statements!) could accomplish.
Figure 3: Inspecting the full call stack of the program.
However, there are some sharp edges when working with these extensions, some due to Positron’s early developmental state and other simply from working with R. And there’s not much help out there in the form of tutorials or Positron-specific documentation. So to help you get started, I’m going to use the rest of this post will show you how I’ve managed to de-burr these raw corners with some helpful functions you can add to your R user profile (a script that is run each time R is launched or restarted) to automate some of these pain points away.
Automating Compiler Options
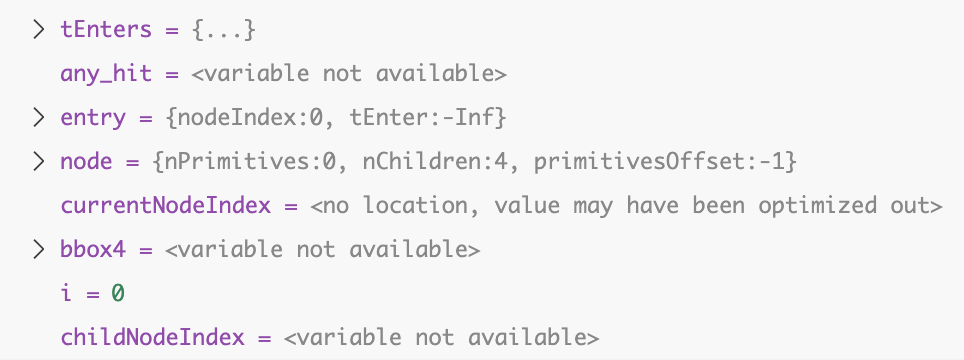
Let’s talk about one of the trickier aspects of debugging C/C++ code: compiler optimization levels. In a perfect world, you’d always run your code with -O2 optimizations for the best performance. But when debugging logic issues, it’s often better to disable optimizations (-O0), so you can trace variable values accurately. It’s hard to debug logic when the written code doesn’t match what’s actually being executed!
Figure 4: The CodeLLDB variable inspector: Note the “value may have been optimized out” and “variable not available” values that appear on some variables when compiled with optimizations.
Changing your compiler options from R
To make switching between optimization levels easier, I wrote the function change_compiler_opt below that you can add to your R user profile. It modifies the Makeconf file that determines the compiler optimization level directly from R, allowing you to change the level without leaving your development environment. It also allows you to select the compiler and whether you want to cache your compilation (using ccache). Here’s the function:
You can edit this file easily from R by calling usethis::edit_r_profile().
.Rprofile
#You will likely want to update the default version and compilerchange_compiler_opt =function(level =2, version ="4.4-arm64", compiler ="clang", cache =TRUE) {if (!compiler %in%c("gcc", "clang")) {stop("Invalid compiler specified. Only 'gcc' and 'clang' are supported.") } level =as.integer(level)#You need to update this path below fileversion =sprintf("/Library/Frameworks/R.framework/Versions/%s/Resources/etc/Makeconf", version) filename =file(fileversion, "rt") makeconf =readLines(filename)# Adjust optimization level newmakeconf =gsub("(-O[0123])", sprintf("-O%d", level), makeconf, perl=TRUE) update_compiler_entry =function(line, compiler, cache) {if (compiler =="gcc") { c_compiler ="gcc" cpp_compiler ="g++" } elseif (compiler =="clang") { c_compiler ="clang" cpp_compiler ="clang++" } line =gsub("(ccache )?(gcc|clang) -arch arm64",sprintf("%s %s -arch arm64",if (cache) "ccache"else"", c_compiler), line) line =gsub("(ccache )?(g\\+\\+|clang\\+\\+) -arch arm64",sprintf("%s %s -arch arm64",if (cache) "ccache"else"", cpp_compiler), line)return(line) } newmakeconf =sapply(newmakeconf, update_compiler_entry, compiler = compiler, cache = cache, USE.NAMES =FALSE)close(filename) filenamewrite =file(fileversion, "wt")cat(newmakeconf, file=filenamewrite, sep="\n")close(filenamewrite)}
1
Check whether the compiler chosen is valid
2
Convert the value to an integer
3
Add the Makefile location (it may be different on your system) and open the file
4
Find and replace all optimization arguments
5
A function to compare each line in the file and replace the compilation calls with the updated arguments
6
Apply the above function to all lines in the file
7
Write and close the files.
There’s a little bit of customization required: you do need to find the path to your own Makeconf file and update the function accordingly. But this function is now an absolutely critical part of my C++ debugging workflow, as I can now quickly change the optimization, recompile (using ccache for speed), spin up the lldb debugger and set up a breakpoint, confirm the fix, and then reset and recompile without exiting the IDE. And that workflow brings us to the second rough edge I’ve “filed down”, via another function you can add to your R profile.
Updating lldb Launch Configurations Dynamically
Currently, you need to manually update the pid in the .vscode/launch.json file when using lldb for debugging compiled code in Positron. This value allows the lldb debugger to attach itself to the correct R process.
This value (usually) changes whenever your crash or manually restart your session, so this is annoying to do if you’re constantly re-compiling and restarting R. The solution? Automate it!
The following function runs whenever you start R, updating the pid in your launch.json file to match the current R session:
.Rprofile
# Function to silently update the PID in launch.jsonupdate_launch_json_pid =function() { current_dir =getwd() launch_json_path =file.path(current_dir, ".vscode", "launch.json")if (!file.exists(launch_json_path)) {return() } current_pid =Sys.getpid() json_content =readLines(launch_json_path, warn =FALSE) json_content =gsub('"pid": [0-9]+', paste0('"pid": ', current_pid), json_content)writeLines(json_content, launch_json_path)}update_launch_json_pid()
1
Get the currect working directory, which in Positron is how projects are defined.
2
The launch.json file we want to edit is stored in the .vscode directory, so we load it.
3
If we aren’t in a project that is using CodeLLDB with a launch.json file, silently do nothing.
4
Get the R processes current PID.
5
Replace the previous entry with the current one.
6
Actually run the function that does all the above.
With this snippet, I can always hit the “run debugger” button in Positron and have it work immediately. Now I just need to wait for Posit to allow us to customize our package build process so I can stop having to paste devtools::install(build = TRUE, args = c("--with-keep.source"),reload = TRUE, quick=TRUE, dependencies = FALSE) manually, which will remove my last “well, that’s slightly annoying” Positron package dev hang-up :)
Note that there is also the option to add "pid": "${command:pickMyProcess}" which will bring up a GUI PID picker in Positron. Also note that this adds an extra manual step that you can avoid by using the above script!
And that’s it for the first post in this series about working with compiled C/C++ code in Positron! In the next post, I’ll talk about using the MacOS Instruments application to profile and optimize your compiled code.